E-COMMERCE ANALYSIS

Solving real problems.

Solving real data.

I aim to suggest improvements and opportunities for increasing sales, refining logistics, and developing customer retention. I hope to convey this info to you in a way that is both digestible and insightful.

This analysis was built with YOU in mind. Enjoy exploring!

E-Commerce Graphic

PROJECT OVERVIEW

Real-World Data

With 100K+ observations, this dataset comes from a Brazilian ecommerce site and lets me explore real-world business questions.

View Data Source

KPIs

I will drive action in this e-commerce business by answering a few stakeholder-like questions regarding...

  • Product Affinity
  • Product Reviews
  • Brazil Sales Behavior

SQL

  • CTEs
  • Joins
  • Aggregate functions
  • Data exploration
  • Query optimization

R

  • Ggplot2
  • Data Cleaning
  • Hypothesis Testing
  • Regression
  • Other statistics

Visualizations

  • Horizontal bar plots
  • Ladder Plots
  • Ridge Density Plots
  • Heat maps
  • More

EXPLORATORY DATA ANALYSIS

EDA Plot
EDA Plot

MAIN ANALYSIS

Product Affinity

The STAKEHOLDER'S QUESTION

Are there any product combinations we should be promoting together because customers often buy them together?

The ANSWER

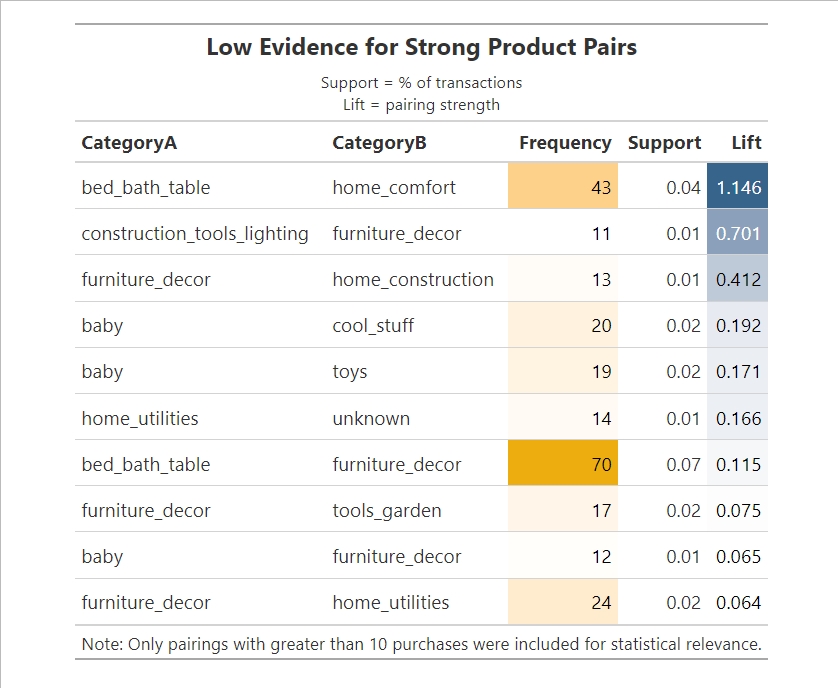
Some home decor categories are selling together, but overall product affinity is weak. Most category pairings show low or negative Lift values. This means customers aren't naturally bundling items.

The SOLUTION

  • There is a need to add/improve our site's recommendation engine (e.g. "Customers who bought X, also buy Y") to guide smarter cross-category purchases.
  • To boost affinity, consider promoting trending combinations on the homepage, offer seasonal bundles, or highlight frequently paired items during checkout.

KEY INSIGHTS

  • Only 785 of 99,439 distinct orders had multi-category purchases
  • When a customer buys bed_bath_table products, they are 14.6% more likely to buy home_comfort products
  • The 10 most common categories make up 62.7% of order purchases.(see "Top Individual Categories" plot above)
EDA Plot

Product Reviews

The STAKEHOLDER'S QUESTION

Which factors are most influencing customer satisfaction as reflected in product reviews?

The ANSWER

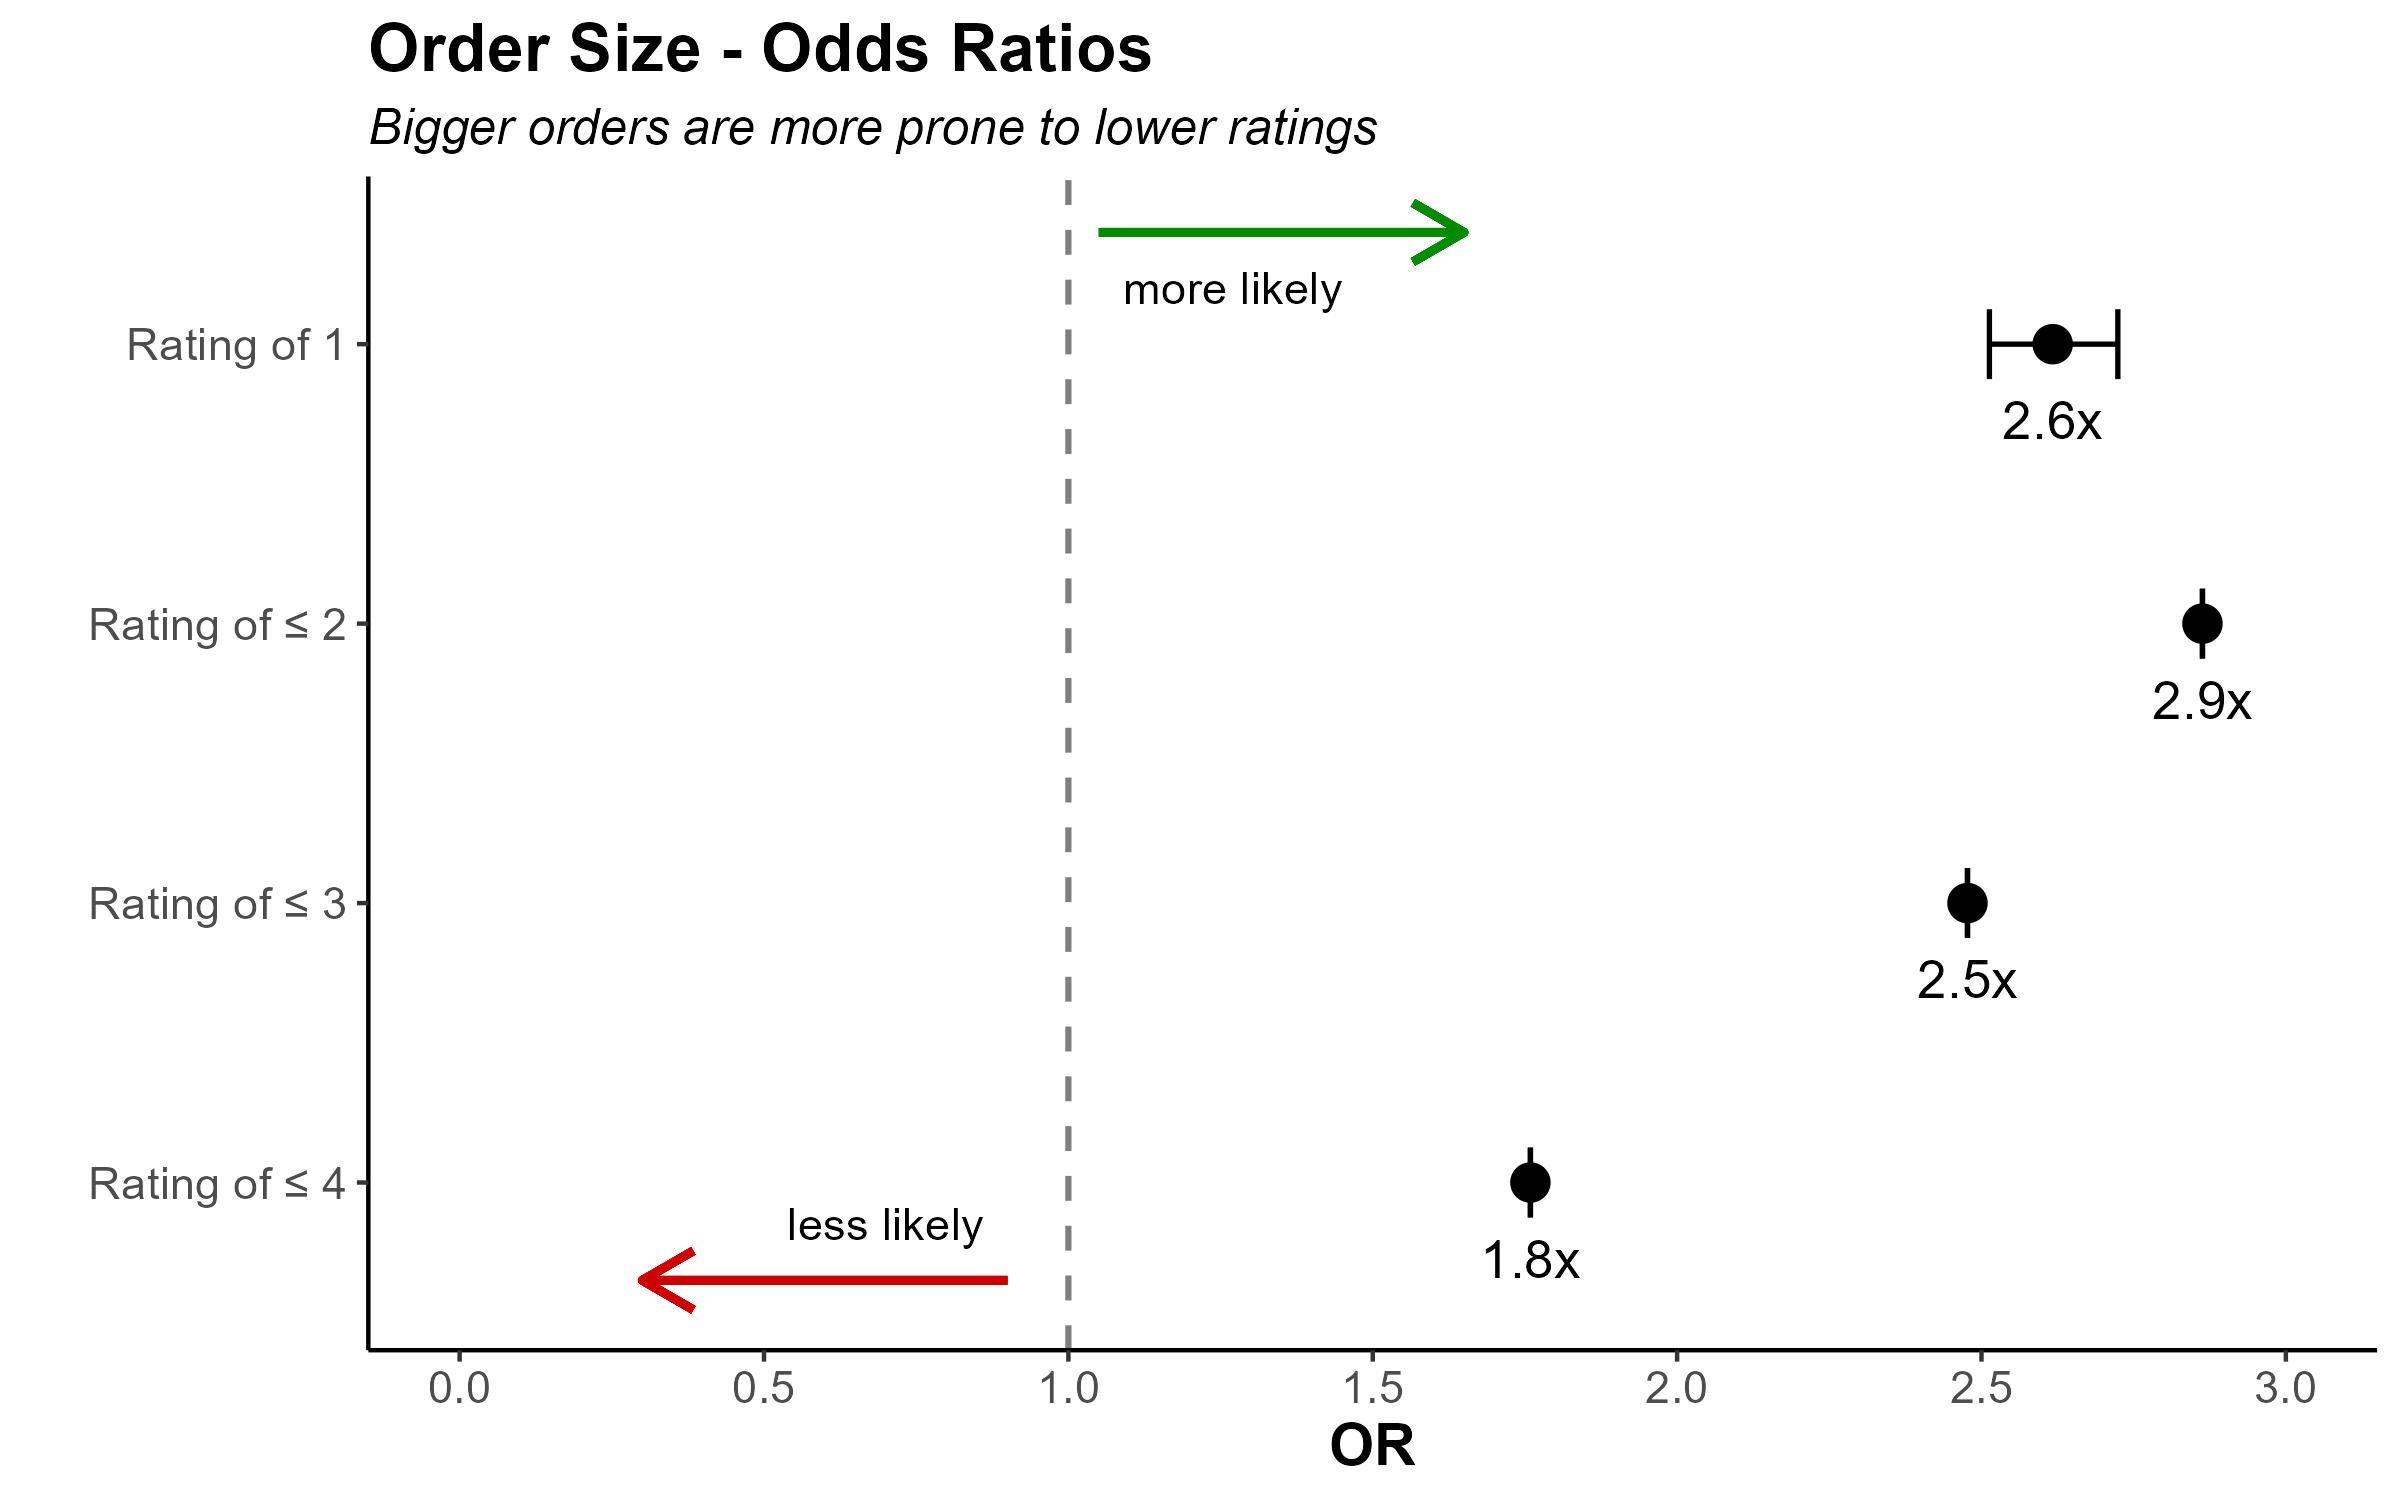
Larger order sizes and longer delivery times are the strongest drivers of lower review scores. Specifically, larger orders are 2.6× more likely to receive a 1-star rating, and extended delivery windows are linked to decreased satisfaction. In contrast, while total price and payment value are statistically significant, their practical impact on review outcomes is small.

The SOLUTION

  • Use review scores as an early warning system for logistics issues. Flag orders with long lead times or sourcing delays before shipment.
  • Prioritize faster fulfillment and shipping for larger orders, which are more likely to receive low ratings.
  • Set clearer delivery expectations on-site to reduce frustration from delays and protect satisfaction scores.
  • Introduce post-purchase check-ins or support for high-price orders, where expectations (and risk of disappointment) may be higher.
  • Focus improvement efforts on operational factors — not price.

KEY INSIGHTS

  • Larger orders are 2.6x more likely to receive a 1-star rating due to a possibility of fulfillment strain or complexity.
  • Delivery time is a huge driver for customer satisfaction; longer deliveries consistently lead to lower ratings.
  • Higher prices are linked to a 7% increase in 1-star ratings, suggesting elevated expectations may backfire.
  • Final payment costs show a statistically significant effect, but with just a 2% shift in odds, it's not a major satisfaction factor.
EDA Plot

Brazil Sales Behavior

The STAKEHOLDER'S QUESTION

Which Brazilian states are generating the highest revenue through our online e-commerce store? Are there any logistics issues?

The ANSWER

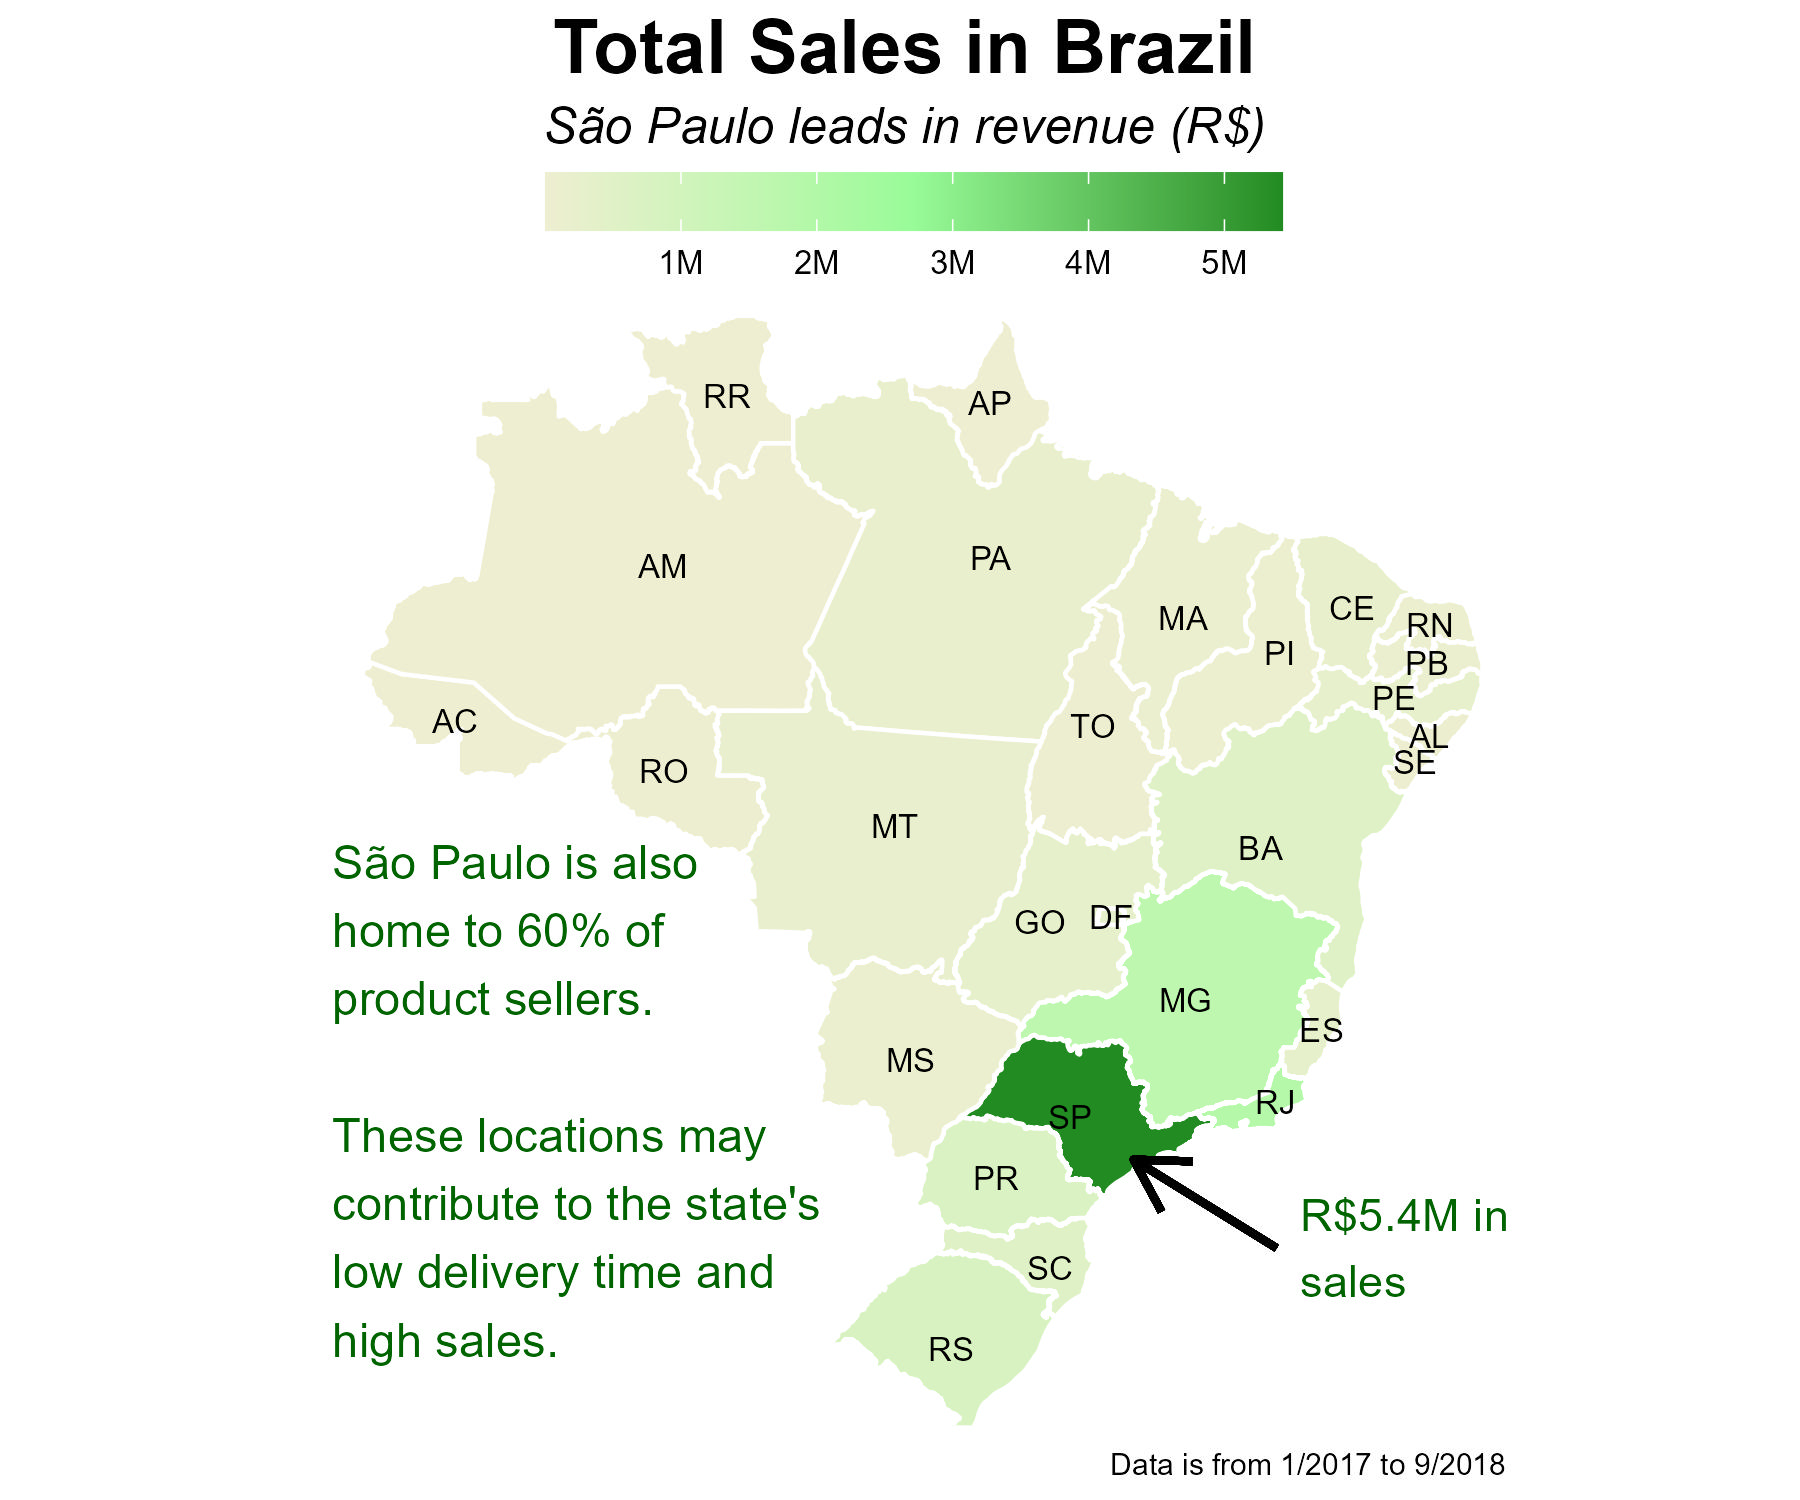
São Paulo and other urban states lead the way in sales revenue. I'm seeing a handful of reasons for this:

  • sellers are mostly located in SP
  • population density
  • access to fast/reliable shipping

  • Nonetheless, I also see BIG opportunities for marketing and logistics to upgrade their strategies to CREATE revenue in these more rural states.

    The SOLUTION

    • Target major cities in low-revenue states (e.g. Manaus, São Luis)
    • Find local sellers in undeserved regions to reduce shipping time
    • Run ads in high-aov, low-order states where shoppers already spend more
    • Offer free shipping for orders above a certain price to eliminate the negative consequences of long delivery times and promote more spending
    • Launch micro-fulfillment pilots in North and Center-West regions to speed up order processing

    KEY INSIGHTS

    • The top 5 revenue generating states accrued 10.4M in sales from 1/2017 to 9/2018
    • 91% of sellers reside in SP, PR, MG, SC, and RJ
    • Customers in more rural states were waiting up to 1 month for their order to be delivered
    EDA Plot

    CONCLUSIONS

    From this large dataset, I uncovered several key focus areas for Olist's e-commerce business. The following insights highlight opportunities for improvement:


    What I Learned: SQL

    Using CTEs boosted my SQL confidence immensely. Visualizing the desired output before writing queries helped me create efficient "micro-tables" that could be directly loaded into R for targeted visualizations.


    Window functions made delivery time calculations far more efficient. They opened a new world for date-based analysis and data comparison.


    What I Learned: R

    R is my go-to tool for data cleaning and automation. Having a clean, repeatable script ensures that changes are easy to implement. If you're not already using R or Python for wrangling data, I strongly recommend starting!


    While R is known for visualization, its customization options continue to impress me. This project marked my first time creating choropleth maps, and resources like the R Graph Gallery were incredibly helpful.


    What I Learned: Business Analysis

    This project opened up countless paths for exploration. My goal was to reflect both in-depth analysis and quick-turnaround insights — the kind stakeholders often rely on from data analysts.


    I hope this inspires other analysts to think beyond the code and build business strategies from the data they work with. There’s always more to uncover within the data you're responsible for.